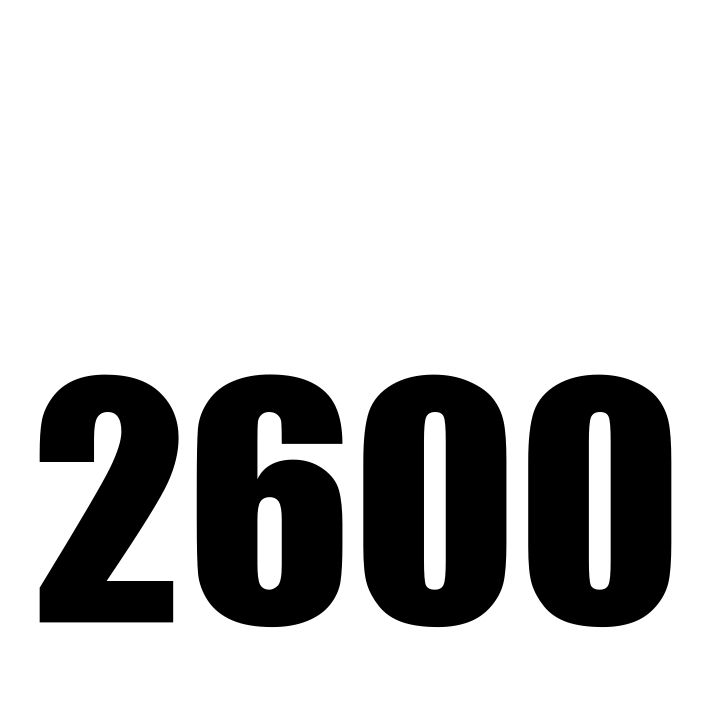
Below is the original image. It’s a 711×711 pixel image of the text, “2600” on a white background.
It was encoded into the following sound at a sample rate of 44,100 Hz for a duration of 10 seconds. The output sound is constrained to be between 0 Hz and 8000 Hz. The gaps between the sounds represent the space between the letters.
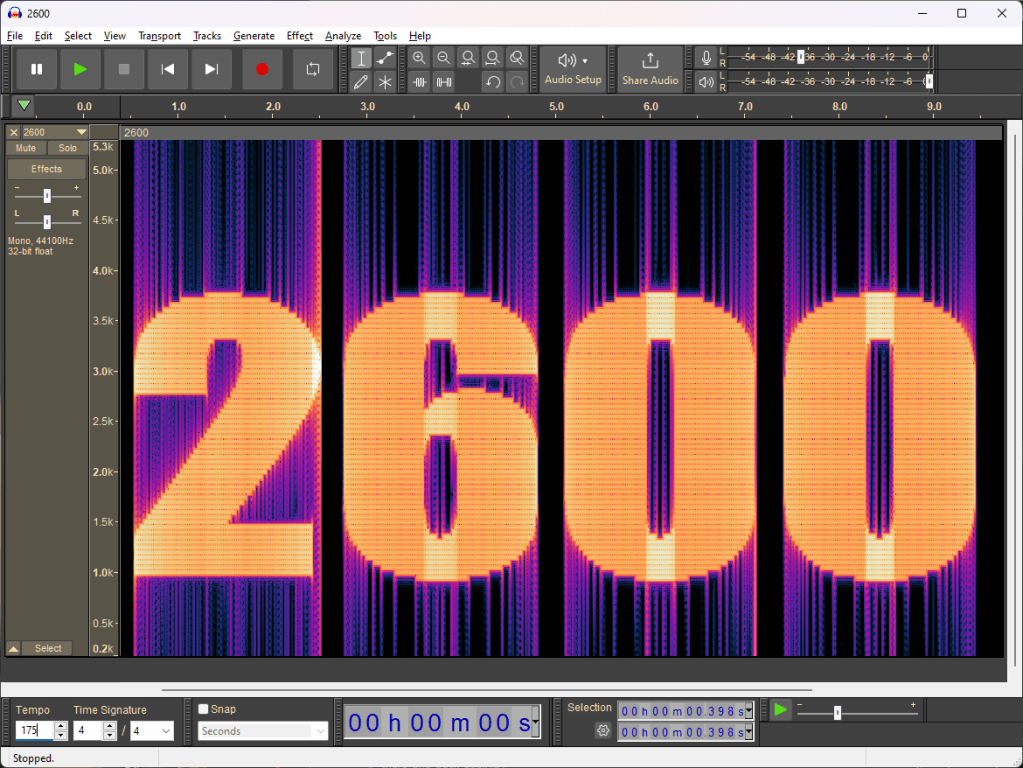
When we import the sound into a sound-editing software, such as Audacity, we can view the sound as a spectrogram, which shows the intensity of sounds at various frequencies along the vertical axis.
The louder the frequency at a given time, the more orange it appears. The horizontal axis represent the time. I THINK the noise extending above and below the numbers in the spectrogram represent the harmonic series of the points where the sounds change frequency.
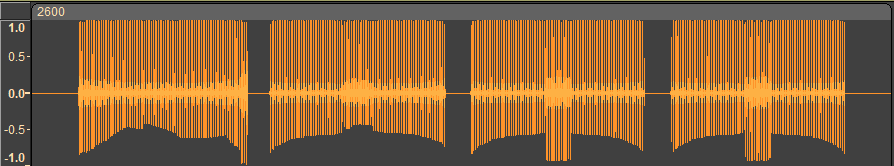
The waveform of the same sound is shown below.